- Infos im HLRS Wiki sind nicht rechtsverbindlich und ohne Gewähr -
- Information contained in the HLRS Wiki is not legally binding and HLRS is not responsible for any damages that might result from its use -
Valgrind: Difference between revisions
No edit summary |
(→Usage) |
||
| Line 48: | Line 48: | ||
}} | }} | ||
{{note|text= For Open MPI there exists a suppression file which can be used with the following command <pre>mpirun -np 4 valgrind --suppressions=$(dirname $(which mpirun))/../share/openmpi/openmpi-valgrind.supp ./app</pre>}} | |||
Revision as of 08:52, 5 October 2012
| Valgrind is an award-winning instrumentation framework for building dynamic analysis tools. There are Valgrind tools that can automatically detect many memory management and threading bugs, and profile your programs in detail. You can also use Valgrind to build new tools. |
| ||||||||||||
Usage
In order to use Valgrind, you need to first load it:
To check your application with Valgrind, please use following command format (take ls command as an example):
Please note, the default checking tool is Memcheck. If you want to use other tools in Valgrind, you have to specify it via --tool=<name> option.
Valgrind can also be used to check parallel application. For example, in order to check an MPI application, please follow the steps:
- First reserve compute nodes:
- Load all necessary tools:
- Run your MPI application with Valgrind:
mpirun -np 4 valgrind --suppressions=$(dirname $(which mpirun))/../share/openmpi/openmpi-valgrind.supp ./app
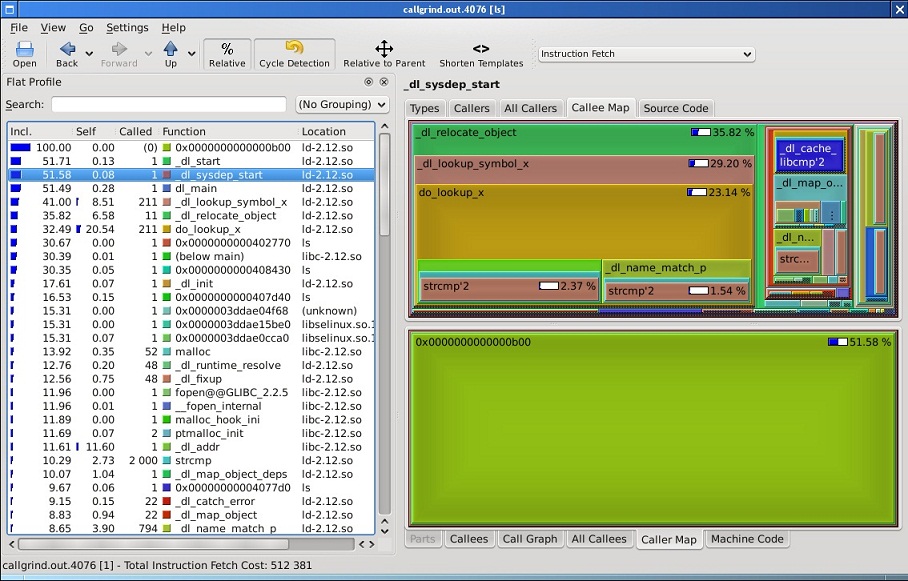
If you want to run Callgrind and later visualize the output in Kcachegrind, you have to do following steps:
- Run your application with Callgrind:
The above command will generate an output file with name callgrind.out.xxxx, where xxxx is the pid of the checked application.
- Load Kcachegrind
- Open Kcachegrind with the generated Callgrind output file. Or open Kcachegrind and load the callgrind file in the GUI.
You will see the Kcachegrind window similar to this:
