- Infos im HLRS Wiki sind nicht rechtsverbindlich und ohne Gewähr -
- Information contained in the HLRS Wiki is not legally binding and HLRS is not responsible for any damages that might result from its use -
Threadspotter: Difference between revisions
From HLRS Platforms
Jump to navigationJump to search
No edit summary |
mNo edit summary |
||
| (5 intermediate revisions by 2 users not shown) | |||
| Line 1: | Line 1: | ||
{{Infobox software | {{Infobox software | ||
| description = RogueWave (formerly Acumem) '''ThreadSpotter''' analyses the application on a binary level (your optimized code compiled with debugging symbols, aka | | description = RogueWave (formerly Acumem) '''ThreadSpotter''' analyses the application on a binary level (your optimized code compiled with debugging symbols, aka <tt>-O2 -g</tt>), finding occurrences of inefficient memory access patterns, such as bad cache usage (using only parts of a cacheline, evicting cache-lines) and cache-effects due to multiple threads. The strength of the tool is in the reporting of problematic source code, giving hints in the code, proposing changes and offering information, how the change may affect cache usage. | ||
| developer = RogueWave (formely Acumem) | | developer = RogueWave (formely Acumem) | ||
| logo = [[Image:roguewave-logo.jpg]] | |||
| available on = [[NEC Nehalem Cluster]], [[Cray_XE6 | Cray XE6]] | | available on = [[NEC Nehalem Cluster]], [[Cray_XE6 | Cray XE6]] | ||
| category = [[:Category: | | category = [[:Category:Performance Analyzer| Performance Analyzer]] | ||
| license = Commercial | | license = Commercial | ||
| website = [http://www.roguewave.com/ | | website = [http://www.roguewave.com/ Roguewave homepage] | ||
}} | }} | ||
== Usage == | == Usage == | ||
Threadspotter is available through modules | Threadspotter is available through modules. After loading the module, the application in question needs to be sampled. | ||
This can either be done through a graphical user interface (GUI), which invokes the application, or by calling sample | |||
{{Command|command = | {{Command|command = | ||
module load performance/ | module load performance/threadspotter | ||
threadspotter | |||
}} | }} | ||
{{Note|text = | {{Note|text = | ||
Do not forget to compile your application with debugging info (<tt>-g</tt> option). | Do not forget to compile your application with debugging info (<tt>-g</tt> option) in order to get line-based source-code information. | ||
}} | }} | ||
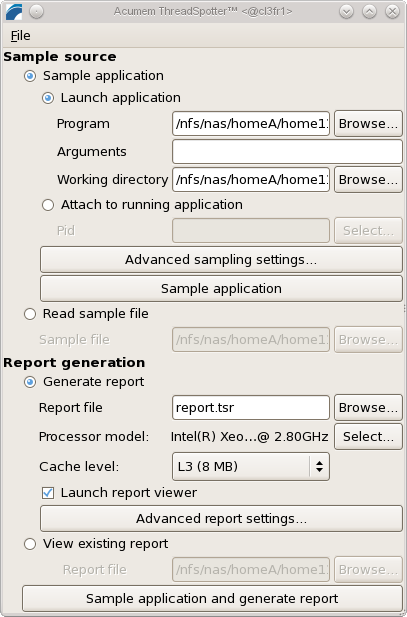
[[Image:threadspotter_gui.png|Threadspotter 2011.1 GUI on Nehalem]] | |||
{{Note|text = | {{Note|text = | ||
Please note, that for the graphical user interface (GUI), | Please note, that for the graphical user interface (GUI) running on compute nodes, You need to submit the interactive session with X11 forwarding: {{{qsub -I -X ...}}} | ||
}} | }} | ||
== Examples == | == Examples == | ||
| Line 30: | Line 35: | ||
{{Command| command = | {{Command| command = | ||
qsub -I -X ... | qsub -I -X ... | ||
module load performance | module load performance/threadspotter | ||
}} | }} | ||
=== Collecting traces | === Collecting traces from MPI parallel applications === | ||
Set up the environment | Set up the environment, loading an MPI implementation, then calling sample with proper script: | ||
{{Command| command = | {{Command| command = | ||
module load performance | module load performance/threadspotter | ||
XXX | |||
}} | }} | ||
| Line 56: | Line 53: | ||
== External links == | == External links == | ||
* [http://www.roguewave.com/ Roguewave homepage] | * [http://www.roguewave.com/ Roguewave homepage] | ||
* [http://www. | * [http://www.roguewave.com/documents.aspx?Command=Core_Download&EntryId=957 Roguewave White Paper "Threadspotter in 30 minutes"] | ||
* [http://www.roguewave.com/documents.aspx?Command=Core_Download&EntryId=1189 HLRS Success Story] | |||
[[Category:Performance Analyzer]] | [[Category:Performance Analyzer]] | ||
Latest revision as of 16:51, 10 January 2012
| RogueWave (formerly Acumem) ThreadSpotter analyses the application on a binary level (your optimized code compiled with debugging symbols, aka -O2 -g), finding occurrences of inefficient memory access patterns, such as bad cache usage (using only parts of a cacheline, evicting cache-lines) and cache-effects due to multiple threads. The strength of the tool is in the reporting of problematic source code, giving hints in the code, proposing changes and offering information, how the change may affect cache usage. |
| ||||||||||||
Usage
Threadspotter is available through modules. After loading the module, the application in question needs to be sampled. This can either be done through a graphical user interface (GUI), which invokes the application, or by calling sample
module load performance/threadspotter
threadspotter
Note: Do not forget to compile your application with debugging info (-g option) in order to get line-based source-code information.
Note: Please note, that for the graphical user interface (GUI) running on compute nodes, You need to submit the interactive session with X11 forwarding: {{{qsub -I -X ...}}}
Examples
Starting on the nodes interactively
Set up the environment
qsub -I -X ...
module load performance/threadspotter
Collecting traces from MPI parallel applications
Set up the environment, loading an MPI implementation, then calling sample with proper script:
module load performance/threadspotter
XXX

