- Infos im HLRS Wiki sind nicht rechtsverbindlich und ohne Gewähr -
- Information contained in the HLRS Wiki is not legally binding and HLRS is not responsible for any damages that might result from its use -
Vampir
| The Vampir suite of tools offers scalable event analysis through a nice GUI which enables a fast and interactive rendering of very complex performance data. The suite consists of Vampirtrace, Vampir and Vampirserver. Ultra large data volumes can be analyzed with a parallel version of Vampirserver, loading and analysing the data on the compute nodes with the GUI of Vampir attaching to it.
Vampir is based on standard QT and works on desktop Unix workstations as well as on parallel production systems. The program is available for nearly all platforms like Linux-based PCs and Clusters, IBM, SGI, SUN. NEC, HP, and Apple. |
| ||||||||||||
Usage
Vampir consists of a GUI interface and a analysis backend. In order to use Vampir, You first need to generate a trace of Your application, preferably using VampirTrace. The Open Trace Format (OTF) trace consists of a file for each MPI process (*.events.z) a trace definition file (*.def.z) and the master trace file (*.otf) describing the other files. Fore details how to generate OTF traces see Vampirtrace.
Vampir
To analyze small traces (< 500 MB of trace data), you can use Vampir standalone with the default backend:
vampir
VampirServer
For large-scale traces (> 500MB and up to many thousand MPI processes), use the parallel VampirServer backend (on compute nodes allocated through the queuing system), and attach to it using vampir:
module load performance/vampirserver
vampirserver start -n $((16*8 - 1))This will show you a connection host and port:
VampirServer 7.5.0
Licensed to HLRS
Running 255 analysis processes.
Server listens on: n010802:30000
Open a new shell window, login to one of the login nodes of the system and open vampir.
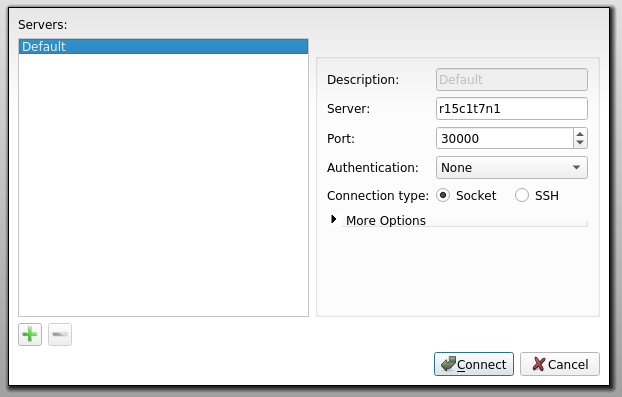
Now use the "Remote open" button and enter the host and port displayed by VampirServer. Proceed and select the trace you want to open.
Hazelhen special
Request an interactive session
Load the vampirserver module
Start the vampirserver on the compute nodes using
This will show you a connection host and port which you have to remember for later:
Launching VampirServer...
VampirServer 8.1.0 (r8451)
Licensed to HLRS
Running 95 analysis processes... (abort with vampirserver stop 61)
VampirServer <61> listens on: nid07625:30000
Open a new terminal with enabled X forwarding (ssh -X ...) and look up on which login node you are, using:
which will display e.g.
eslogin005
Now go back to the terminal running the interactive session and forward the vampirserver to the login node using the connection info from the vampirserver output before:
Now you can proceed opening vampir on the login node and connect to localhost at the forwarded port number in vampir using Open Other...-->Remote File.

